You can, of course, insert a chart you’ve created in Google Sheets already. But for those last-minute, on-the-spot pie charts or bar graphs, take advantage of the tools Google Docs provides.
Insert a Chart in Google Docs
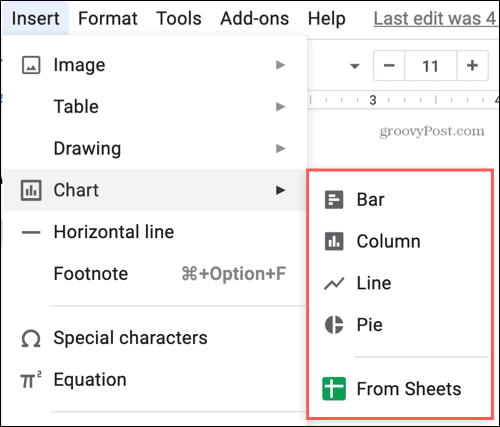
Head to Google Docs, open your document, and place your cursor where you’d like the chart. Then follow these simple steps.
And that’s it! You now have a nice chart in your document, ready for the details you want to use.
Add Your Chart Data
You don’t have to have a lot of data for your chart. It can even be details you gathered on the fly. And it’s easy to add your data. When you first insert the chart, you’ll see a pop-up message at the bottom for Chart Inserted: Edit in Sheets. If you click Edit in Sheets, you’re directed right to the chart in Google Sheets in a new tab to add your data.
Now that message only appears briefly. So if you miss it, don’t worry, there’s another way to add your chart details. Select the chart and you’ll see an arrow display on the top right of it. Click the arrow and pick Open Source.
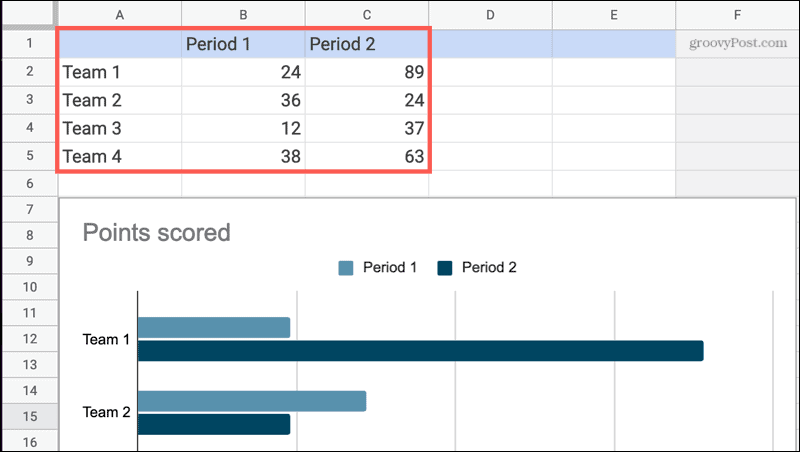
A new tab will open displaying your chart and example data in Sheets. Just use the cells at the top to add your information and you’ll see the chart update immediately below it.
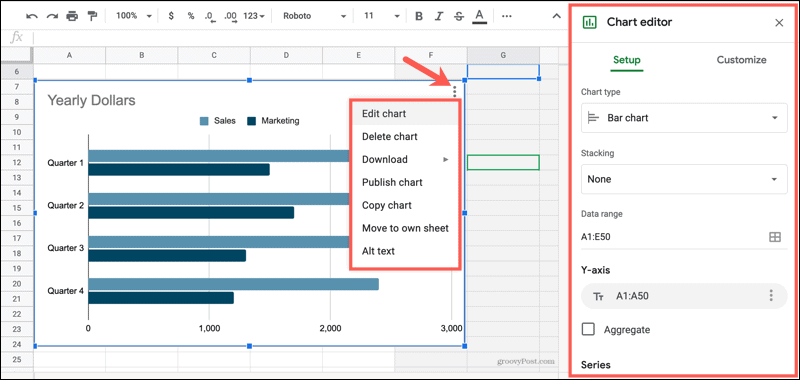
If you’d like to make in-depth changes to your chart, you can do so here as well. Select the chart below the data, click the three dots on the top right of it, and pick Edit Chart. This opens the Chart Editor on the right where you can edit the title, change the chart type, add a series, and more.
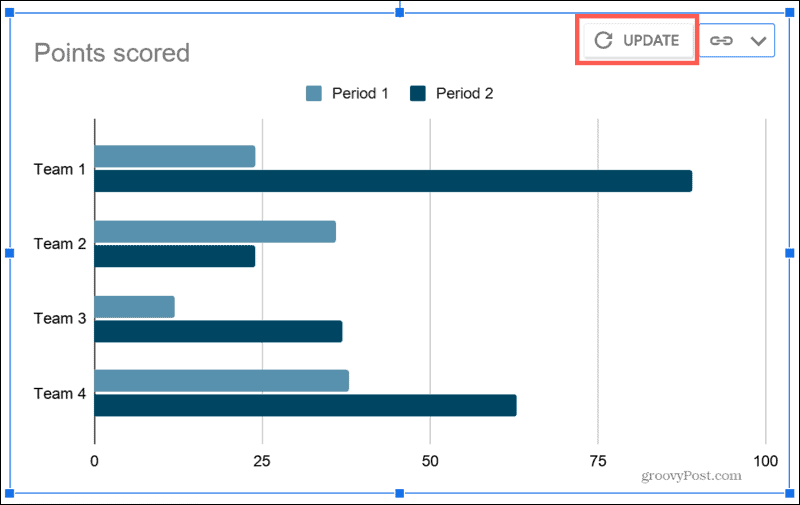
When you finish adding data or making edits, go back to your document in Google Docs and you’ll see an Update button on your chart. (You may have to select the chart to see the button.) Click Update and you’ll have your updated, data-filled chart.
Any time after your initial data input, you can follow these same steps to edit the data in your chart.
Change the Chart Appearance
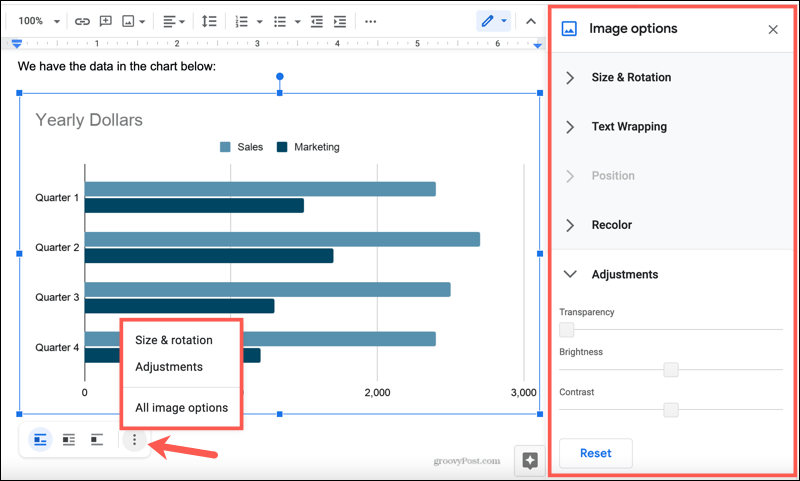
While the charts you receive in Google Docs are fine and dandy, you might want to change the appearance. Maybe you want to use your company’s colors, adjust the size, or make it brighter.
Insert a Quick Chart in Google Docs for a Great Visual
Sometimes a simple chart is all your document needs to make it more professional or useful to the reader. So the next time you create a document in Google Docs, consider adding a quick chart! If you’d like to take your charts and graphs a bit further, take a look at these add-ons for creating diagrams in your Google Docs documents.


![]()
